Your Dashboards Are Quietly Costing You Thousands of Dollars Every Month — And Nobody Is Measuring It
Discover the proven framework Qlik Sense consultants use to diagnose, fix, and prevent slow analytics — so your team makes faster decisions, your users actually trust your dashboards, and your BI investment finally pays off.
📘 GET THE EBOOK NOW — JUST $19 Instant PDF download · 30-day money-back guarantee★★★★★ Trusted by BI professionals, analysts, and Qlik developers worldwide
The 5 Silent Killers of Every Analytics Investment
You spent months (and a serious budget) rolling out Qlik Sense. Leadership was promised "data-driven decisions at the speed of thought." But here's what's actually happening every single day:
Dashboards That Take Forever to Load
Every chart spins for 10, 20, 30 seconds. Users click… wait… click again… and give up. A dashboard that takes 25 seconds to load isn't a tool — it's a deterrent.
Lost Productivity Across Your Entire Team
If 50 users each lose just 10 minutes a day waiting on slow apps, that's over 2,000 hours a year — one full-time employee doing nothing but watching loading spinners.
Poor (and Late) Decision Making
When data is slow, people stop checking it. Decisions get made on gut feeling, outdated exports, and "the numbers from last month." The whole point of BI quietly dies.
Frustrated Users Who Abandon Your Dashboards
Adoption craters. Users go back to Excel. Your beautifully designed apps sit unused while shadow spreadsheets multiply across departments.
Direct Revenue Impact Nobody Tracks
Missed pricing opportunities. Slow reaction to stock-outs. Delayed responses to churn signals. Slow analytics isn't an IT inconvenience — it's a P&L problem hiding in plain sight.
Here's What Happens If You Keep Ignoring It
Slow analytics doesn't stay the same. It compounds. Every new app copies the same bad data model. Every quarter, more data piles onto an architecture that was already struggling. Twelve months from now, one of two things will be true:
❌ If nothing changes
- Dashboards get slower as data volumes grow 30–50% per year
- Users quietly defect to Excel and "their own numbers"
- Leadership asks why the BI budget grows while adoption shrinks
- Your team firefights sprint after sprint instead of building
- Someone proposes "replacing Qlik" — when the tool was never the problem
✅ If you fix performance now
- Apps load in under 3 seconds and users open them daily
- Your data models become templates the whole team reuses
- IT stops getting "the dashboard is broken" tickets
- You become the person who saved the BI investment
- Decisions get made on live data — not last month's export
The difference between these two futures isn't budget, headcount, or switching tools. It's knowing exactly where performance leaks happen — and how to plug them. That's what this ebook gives you.
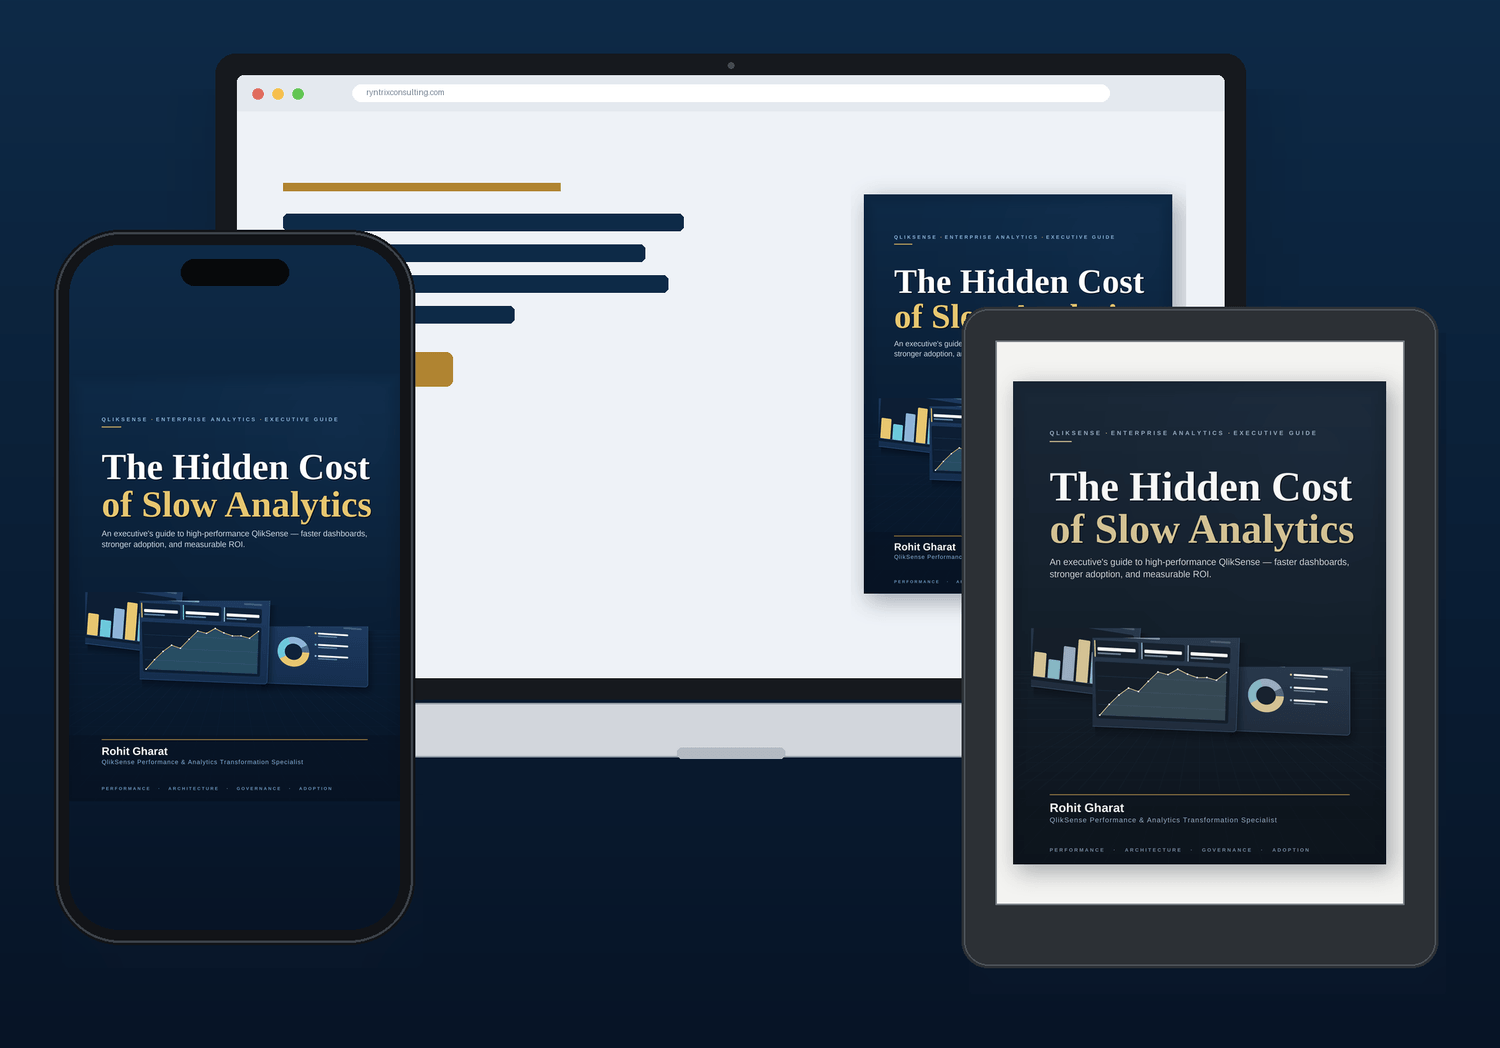
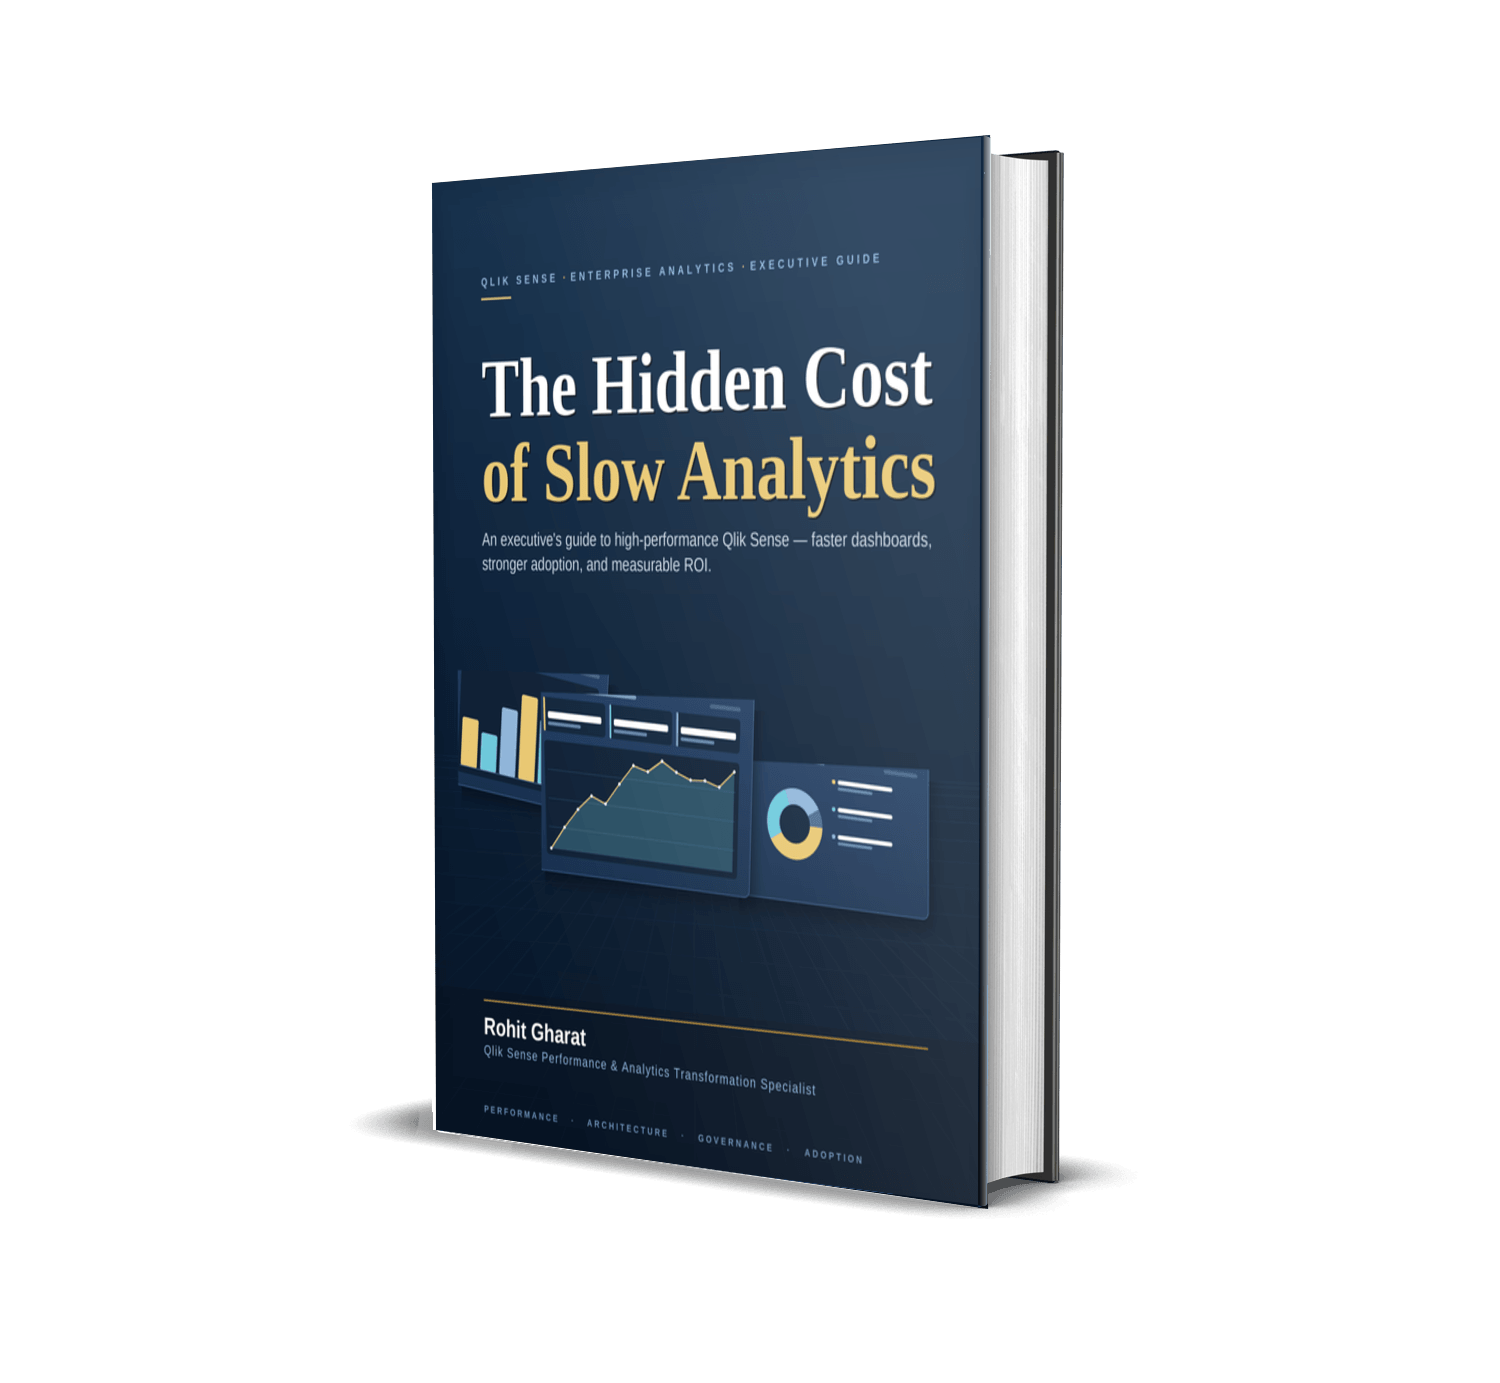
The Hidden Cost of Slow Analytics
The practical, no-fluff playbook for diagnosing and fixing slow Qlik Sense dashboards — written by a consultant who does this for a living.
This isn't theory from someone who read the documentation. It's the exact diagnostic process, optimization checklist, and architecture principles I use on real client engagements — distilled into a PDF you can read in one sitting and apply the same day. No 400-page manual. No vendor marketing. Just the 20% of performance work that delivers 80% of the speed.
Inside the Ebook, You'll Discover:
- The 3-second rule — the load-time threshold where user adoption falls off a cliff (and how to consistently beat it)
- How to calculate the real dollar cost of your slow dashboards in under 15 minutes — perfect for building a business case to leadership
- The #1 data model mistake behind 80% of slow Qlik Sense apps (it's not what most developers think)
- A step-by-step performance diagnostic checklist — find your exact bottleneck in 30 minutes instead of guessing for weeks
- Why "just add more RAM" almost never fixes the problem — and what actually does
- The set analysis and expression patterns that silently destroy chart calculation times (with faster alternatives)
- How to use star schemas, link tables, and aggregation layers the right way — explained in plain English
- The section access and security mistakes that multiply your app's memory footprint
- A simple reload optimization framework that can cut script run times by 50% or more
- How to set up performance monitoring so you catch degradation before users complain
- The governance habits that keep apps fast as your data grows — fix this once, not every quarter
- A complete pre-launch performance checklist to run before any app goes to production
What's Inside — Chapter by Chapter
The Invisible Tax
How slow analytics silently drains productivity, trust, and revenue — and a simple formula to quantify what it's costing your organization right now.
Why Dashboards Get Slow
The complete anatomy of Qlik Sense performance: data model, expressions, app design, hardware, and reloads — and how to tell which layer is hurting you.
The 30-Minute Diagnostic
A step-by-step process to pinpoint your exact bottleneck using built-in tools — no expensive monitoring software required.
Data Modeling for Speed
Star schemas, synthetic key elimination, link tables, and the field-level optimizations that make the engine fly.
Expressions That Don't Hurt
Set analysis done right, the aggregation traps to avoid, and how to refactor your heaviest charts without changing what users see.
Reload & Architecture Optimization
Incremental loads, QVD layering, and scheduling strategies that cut reload windows dramatically.
Keeping It Fast Forever
Monitoring, governance standards, and the developer checklist that prevents performance debt from creeping back in.
Bonus: The Stakeholder Playbook
How to present performance wins to leadership — and turn "the dashboard person" into "the person who saved our BI investment."
This Isn't About Faster Dashboards. It's About What Faster Dashboards Get You.
Decisions at the Speed of Business
When dashboards load instantly, people check them constantly. Pricing, inventory, and customer decisions happen on today's data — not last week's export.
Adoption That Justifies Your BI Budget
Fast apps get used. Used apps get funded. You'll have the usage metrics to defend (and grow) your analytics investment.
Hundreds of Recovered Hours
Cut average load times from 20 seconds to 3, multiply across every user and click, and watch entire workweeks come back to your organization.
Fewer Fires, More Building
Stop spending sprints on "why is this app slow?" tickets. Your team ships new analytics instead of patching old ones.
Career Capital for You
Performance wins are visible, measurable, and rare. Being the person who makes analytics fast is one of the fastest ways to stand out in any BI team.

Written by Someone Who Fixes This for a Living
Hi, I'm Rohit Gharat, a Qlik Sense consultant specializing in analytics performance and data architecture. Over the past 13+ years, I've worked with companies across Healthcare, Retail, Finance, Automobile, Travel, Beverages Industries to rescue slow dashboards, redesign data models, and turn abandoned BI deployments into tools people actually use every day.
I wrote this ebook because I kept solving the same problems on every engagement — and realized most teams don't need a six-figure consulting project. They need a clear, honest playbook of what actually moves the needle. Everything in these pages comes from real client work. I've simply removed the invoice.
Order Today and Get These Bonuses FREE
Bonus 1: The Qlik Sense Performance Checklist ($29 value)
The exact one-page checklist to run on any app before it goes to production. Print it, pin it, make it your team's standard.
Bonus 2: Dashboard Cost Calculator ($39 value)
Plug in your user count, average load times, and salary data — instantly see what slow analytics costs your organization per year. Perfect for leadership presentations.
Bonus 3: The Expression Optimization Cheat Sheet ($19 value)
Side-by-side "slow vs. fast" patterns for the most common set analysis and aggregation expressions. Keep it open while you refactor.
Total bonus value: $87 — yours free with the ebook today.
Get Everything Today for Less Than a Team Lunch
- The Hidden Cost of Slow Analytics (full ebook) — $49 value
- Bonus 1: Performance Checklist — $29 value
- Bonus 2: Dashboard Cost Calculator — $39 value
- Bonus 3: Expression Cheat Sheet — $19 value
- Total value: $136 → Today: $19
Every Day You Wait, the Spinner Keeps Spinning
Right now, somewhere in your organization, someone just opened a dashboard… waited… sighed… and went back to Excel.
That moment repeats hundreds of times a week. It's costing you hours, trust, and money — and it will not fix itself. For $19 — less than a single hour of a junior analyst's time — you can have the complete playbook to end it. You're protected by a full 30-day guarantee, so the only risk is staying slow.
Fast dashboards. Trusted data. A BI investment that finally delivers. It starts with one click.
🚀 YES — GIVE ME THE EBOOK FOR $19 Instant download · PayPal secure checkout · 30-day money-back guarantee